 |
Figure 2.
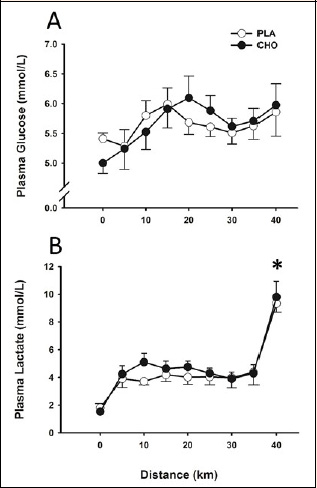
Plasma glucose (A) and plasma lactate (B) concentrations throughout 40 km time-trial. Data are mean ± SE. * p < 0.05 for 40 km mark compared with baseline values.
|
|
|
Figure 2.
Plasma glucose (A) and plasma lactate (B) concentrations throughout 40 km time-trial. Data are mean ± SE. * p < 0.05 for 40 km mark compared with baseline values.
|