 |
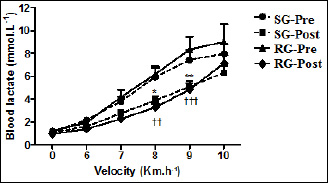
Figure 1.
Blood lactate behavior for kinetics during incremental test. SG = soccer group, RG = running group, Pre = period before intervention and Post = period after intervention. Blood lactate is expressed as mmol·L-1 and presented as mean ± S.E.M. * p < 0.05 and ** p < 0.01 when compared pre and post in SG and † † p < 0.01 and † † † p < 0.001 in RG by two-way analysis of variance (ANOVA) followed by Bonferroni’s multiple comparison test.