 |
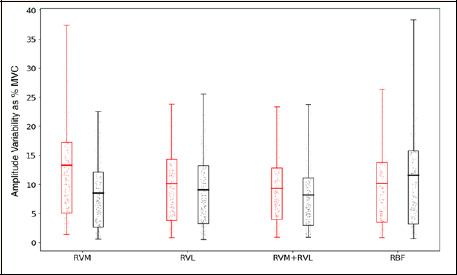
Figure 6.
Boxplot representing repetition amplitude variability as % MVC at speed 60 deg/s for each muscle group measured. Rep amplitude normalized based on MVC. Whisker limits represent 5th and 95th percentiles and the line within each box represents the mean. Red = Athos, Black = Biopac. RVM = vastus medialias, RVL = vastus lateralis, RBF = bicep femoris.