 |
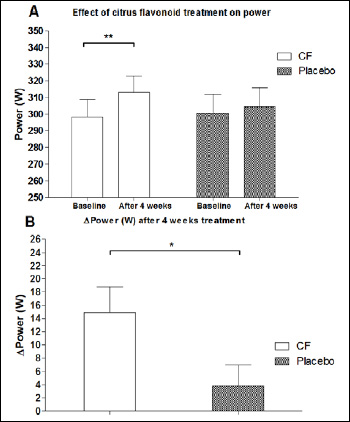
Figure 2.
A) After 4 weeks of supplementation, the average power in the CF group was increased with 5% (p = 0.001**), while no significant increase was noted in the placebo group (p = 0.243). Values are expressed as mean ± SEM. B) The increase in power after 4 weeks treatment compared to baseline (∆T2-T1) is significantly higher within the CF group than within the placebo group (p = 0.032*). Values are expressed as mean ± SEM.