 |
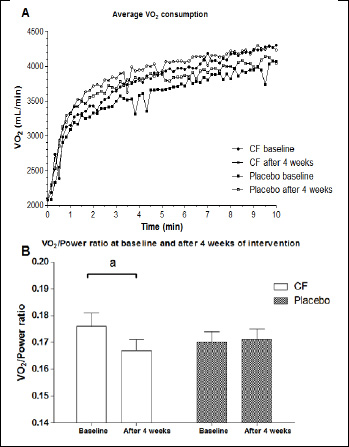
Figure 3.
A) Average VO2 consumption over time in both groups, before and after 4 weeks of intervention. B) The VO2/power ratio was significantly decreased in the CF group compared to the ratio at baseline (p = 0.001**). Values are expressed as mean ± SEM.