 |
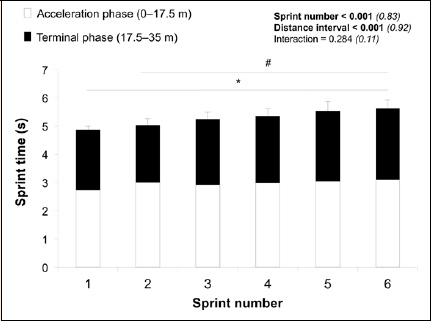
Figure 1.
Changes in sprint times over the six repetitions of the repeated-sprint anaerobic sprint test. Data at the 0–17.5 m (white) and 17.5–35 m (black) distance intervals (acceleration and terminal phases, respectively) are presented. Values are mean ± SEM. * significantly (P < 0.05) different between the two intervals. # significantly (P < 0.05) different from sprint number 1.