 |
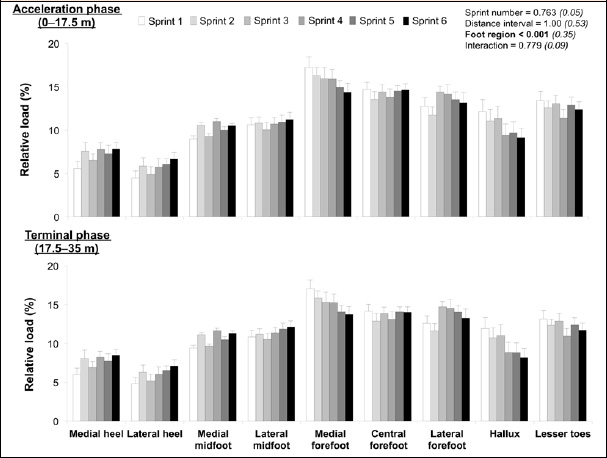
Figure 3.
Relative load for each foot region over sprint repetitions at the 0–17.5 m (top panel) and 17.5–35 m (bottom panel) distance intervals (acceleration and terminal phases, respectively). Values are mean ± SEM. Note that for improved clarity post hoc results for main effect of foot region are not displayed.