 |
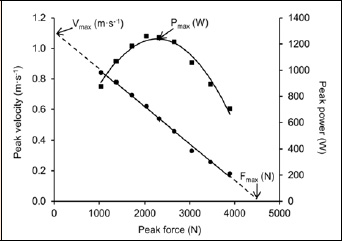
Figure 1.
An example single leg force-velocity and power output relationship. Square markers: Power output data points, circle markers: force-velocity data points. Solid lines: line of best fit through each respective data point, dashed line: extrapolation to calculate velocity max and force max.