 |
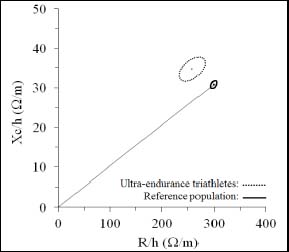
Figure 2.
RXc mean graph. The 95% confidence ellipses for the mean impedance vectors of triathletes (dotted line ellipse) and the healthy male reference population (solid line ellipse with vector) (Piccoli et al., 1995) are shown. R/h, height-adjusted resistance; Xc/h, height-adjusted reactance.