 |
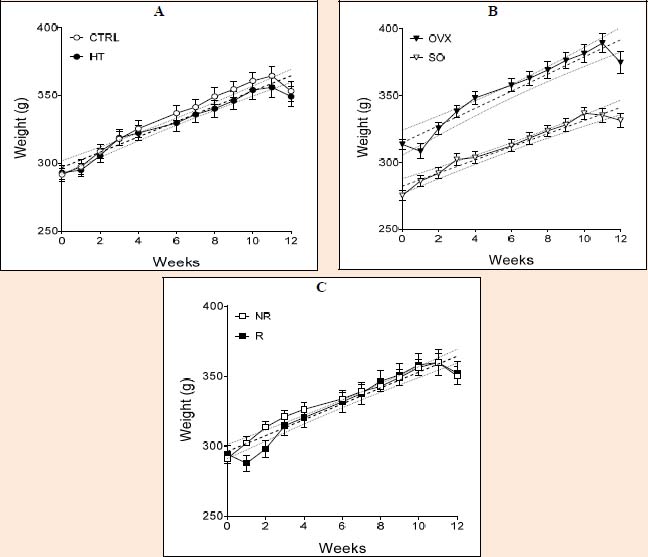
Figure 2.
Development of body weight of animals during the 12-week training/feeding period (A; high-triglyceride, B; ovariectomized, C; running). The thick dotted lines show the fitted straight lines, while the thin dotted curves represent their 95% confidence bands. SO = sham-operated, OVX = ovariectomized, CTRL = standard chow, HT = high-triglyceride, NR= non-running, R=running.