 |
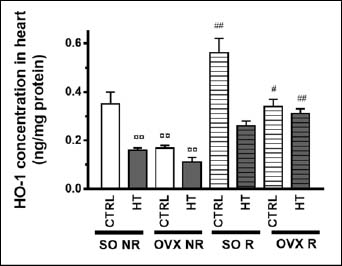
Figure 6.
Effects of 12-week physical exercise and high triglyceride diet on cardiac HO-1 concentrations. Changes in HO-1 concentration (expressed as ng/mg protein) are expressed as mean ± SEM (n = 6-11). Statistical significance: â—‹â—‹ p < 0.01 as compared to SO CTRL NR group and ## p < 0.01, # p < 0.05 a significant difference between non-running (NR) and running (R) animals. SO = sham-operated, OVX = ovariectomized, CTRL = standard chow, HT = high-triglyceride, NR= non-running, R = running.