 |
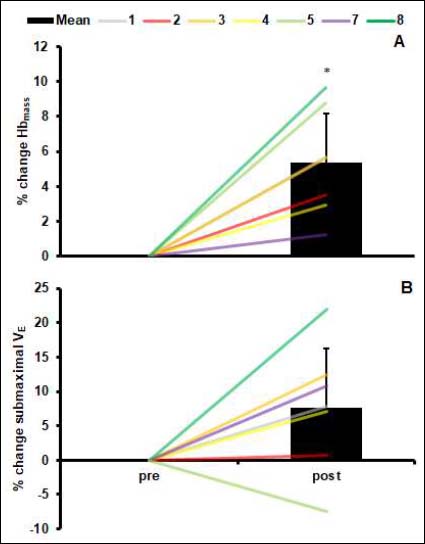
Figure 4.
Percentage change in Hbmass (A) and submaximal V̇E (B) following 3-4 weeks of LHTH for n = 7 (Participant 6 excluded due to illness during post testing). Coloured lines are individuals indicated in the legend, with histograms showing the group response. * p < 0.01.