 |
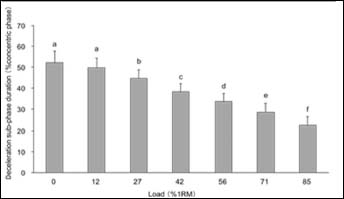
Figure 3.
Relative duration of the deceleration sub-phase (%). The different letters indicate the significant differences between the loads (post-hoc test, p < 0.05).
|
|
|
Figure 3.
Relative duration of the deceleration sub-phase (%). The different letters indicate the significant differences between the loads (post-hoc test, p < 0.05).
|