 |
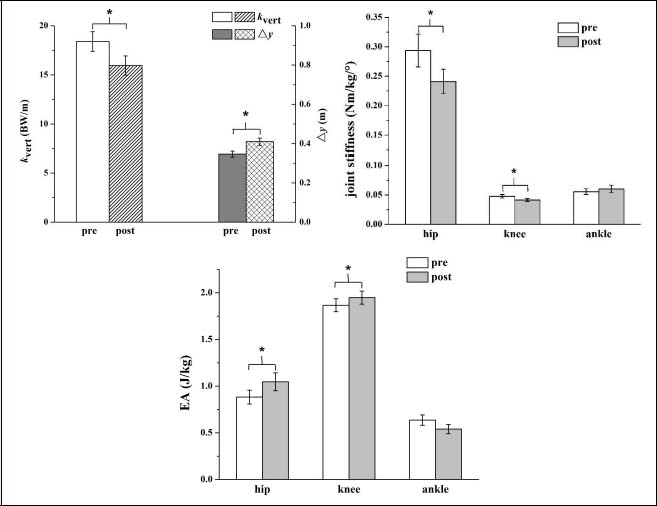
Figure 4.
Comparison of kvert and ∆y (left upper) and joint stiffness (right upper), and the EA in the hip, knee, and ankle joints (lower) during landings between pre- and post-fatigue conditions. *Significant differences between pre- and post-fatigue conditions, p < 0.05. pre = pre-fatigue; post = post-fatigue; kvert = vertical stiffness; ∆y = the maximum vertical displacement of the center of mass; EA = energy absorption.