 |
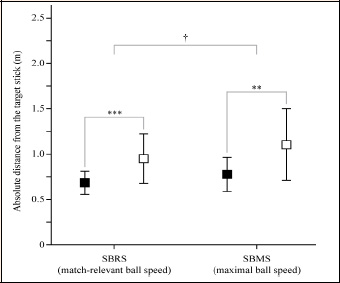
Figure 2.
The effect of kicking effort and leg preference on side foot-kick accuracy, measured as the absolute distance from the centrally positioned target stick. Squares represent mean values and error bars represent ±1 standard deviation, where black squares represent preferred-leg kicks and white squares represent non-preferred-leg kicks. Significant differences are reported as: † for p < 0.05 (difference between tests); ** for p < 0.01 (between leg difference); and *** for p < 0.001 (difference between legs).