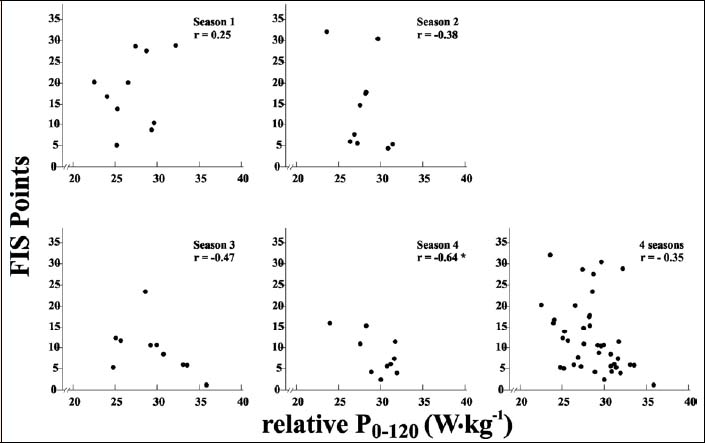
Figure 6.
Scatter plots of P
0-120
and FIS points for each of 4 seasons for each subject. * p < 0.05