 |
Figure 8.
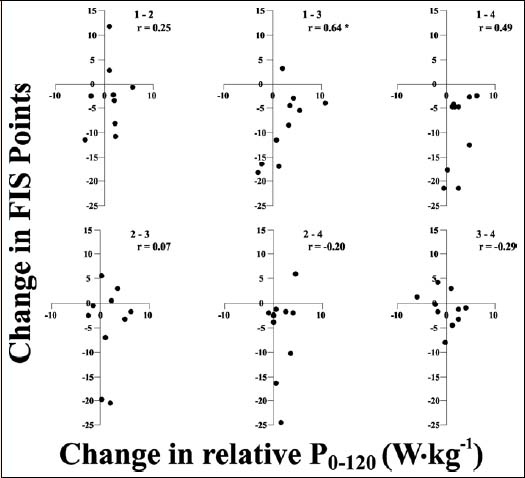
Scatter plots of the comparisons of season-to-season changes in P0-120 and FIS points for each of 4 seasons for each subject.
|
|
|
Figure 8.
Scatter plots of the comparisons of season-to-season changes in P0-120 and FIS points for each of 4 seasons for each subject.
|