 |
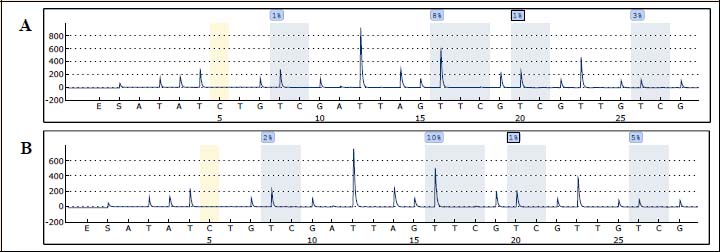
Figure 1 (Panel A-B).
Typical Pyrograms showing methylation status at CpG sites within the MMP11 gene promoter from control and PT samples. The CpG sites are shown shaded in blue/grey with the percentage (%) methylation above each site. Yellow shaded areas are bisulfite controls. Panel A) Percentage methylation at four CpG sites within the MMP11 gene promoter from a CON sample. Panel B) Percentage methylation at four CpG sites within the MMP11 gene promoter from a PT sample. Sites from left to right are: -38 (CpG 1), -55 (CpG 2), -58 (CpG 3) and -65 (CpG 4) bp respectively from the first exon of the MMP11 gene.