 |
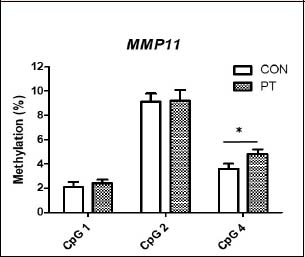
Figure 2.
Comparison of the mean DNA methylation between the CON and PT groups within the promoter region of the MMP11 gene. Sites are: -38 (CpG 1), -55 (CpG 2) and -65 (CpG 4) bp respectively from the first exon of the MMP11 gene. Bars represent mean (%) ± standard error of the mean (SEM). CON, white bars and PT, shaded bars. *, p = 0.045.