 |
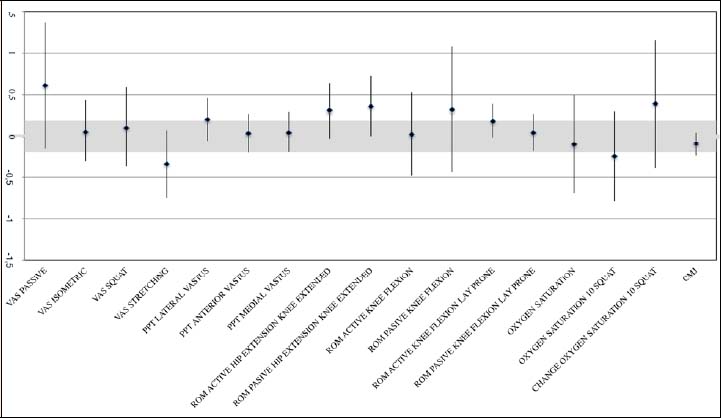
Figure 3.
Forest plot with standardized mean differences (SMD) and 90% confidence interval (CI) for dependent variables. Lower scores (i.e., to the bottom in the X-axis) means lower scores in the VFR group. NVFR, non-vibration foam roller group; VFR, vibration foam roller group; VAS, visual analogic scale; ROM, range of movement; PPT, pressure pain threshold.