 |
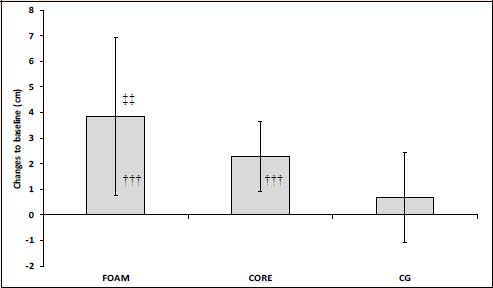
Figure 3.
Delta changes (mean ± SD) in stand-and-reach performance from baseline to post-intervention measurements. ‡‡ p < 0.01, significantly different to CG; † † † p < 0.001, significantly different from baseline levels within the group. FOAM = foam roll group; CORE = core stabilization group; CG = control group