 |
Figure 2.
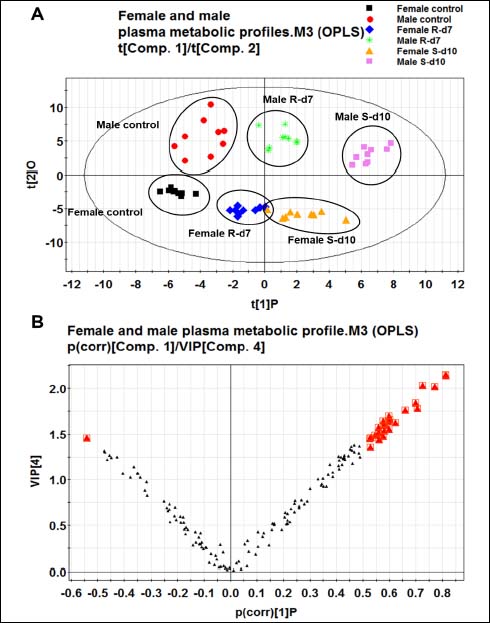
The score plot of OPLS analysis to compare the metabolome of male and female rats from control, exhaustive exercise and recovery groups (n=10 per group). A: The score plot showed distinct clustering of metabolites with gender and exhaustive exercise periods. Metabolic patterns were grouped by different colored points. One point represents one sample. B: The loading plot was created to display the specific metabolites positively correlated with score plot. Each point presents one variable (metabolite). The bigger red triangle ( ) indicates statistically significant difference in variables that differentiated these groups. S-d10: 10-day swimming (exhaustive exercise group); R-d7: 7-day recovery.
) indicates statistically significant difference in variables that differentiated these groups. S-d10: 10-day swimming (exhaustive exercise group); R-d7: 7-day recovery.