 |
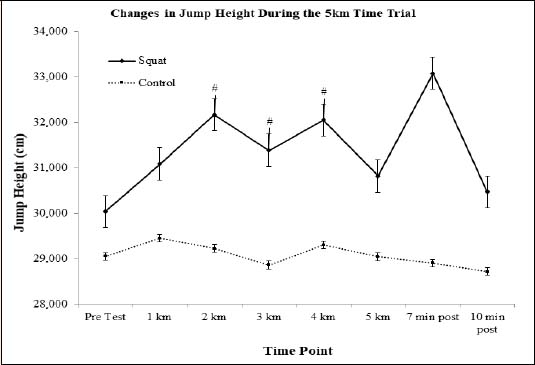
Figure 5.
Representative graph demonstrating the changes seen in jump height during the squat and control conditions. Significant changes observed in the squat condition. # indicates the squat condition value was significantly greater than the control condition.