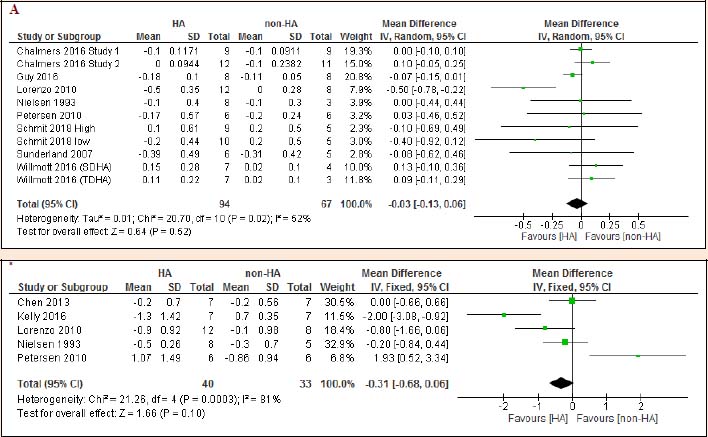
Figure 8.
Forest plot of effect of HA on core temperature (A) and skin temperature (B).