 |
Figure 3.
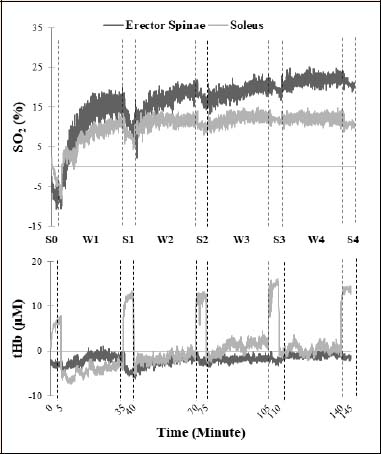
Response changes relative to the seated baseline for one subject in ES and SOL SO2 (top) and tHb (bottom) during the trial. The 5 minutes between dotted lines denote the standing periods.
|
|
|
Figure 3.
Response changes relative to the seated baseline for one subject in ES and SOL SO2 (top) and tHb (bottom) during the trial. The 5 minutes between dotted lines denote the standing periods.
|