 |
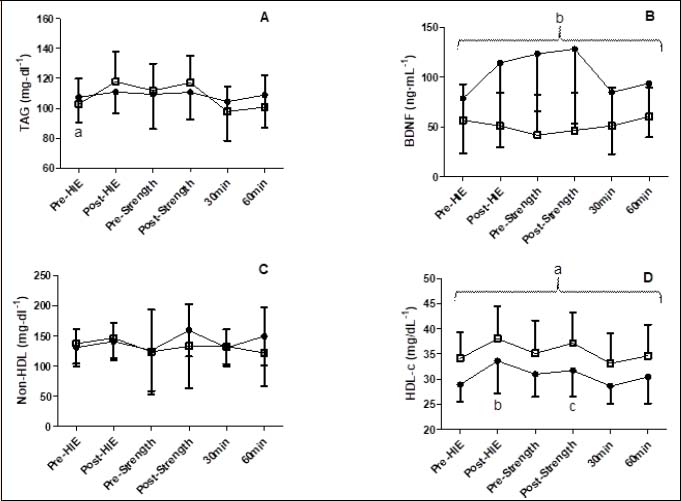
Figure 2.
A and B Mean and standard deviation of TAG and BDNF before (â—) and after (â– ) 8-weeks of HIIE plus strength exercise. a = lower than post-HIE, pre-SE post-SE; and post-30 exercise session; b = lower than pre-training values. C and D Mean and standard deviation of non-HDL and HDL-c before (â– ) and after (â—) 8-weeks of HIIE plus strength exercise. a = higher than pre training values; b = higher than pre-HIE, 30- and 60-min post exercise session; c = higher than 30-min post exercise session.