 |
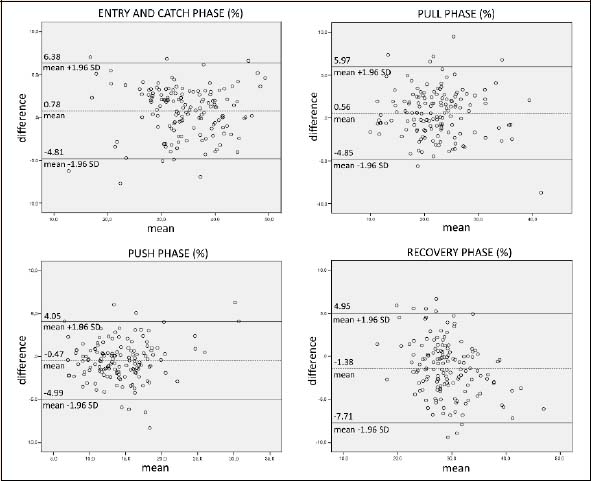
Figure 6.
Bland–Altman plots representing mean (x-axis) and difference (y-axis) between the values of stroke phase detection in percentage of the complete cycle estimated by 2D video analysis (TLC) and 3D wrist trajectory using inertial sensor devices (IMMU). The solid and dotted lines represent the ± 1.96 SD limits of agreement and the mean, respectively.