 |
Figure 1.
Percental changes in muscle cross-sectional area at 50% of femur length from pre- to post measurements between the groups (M ± SEM). Differences were analyzed using RMANOVA (* = p < 0.01)
|
|
|
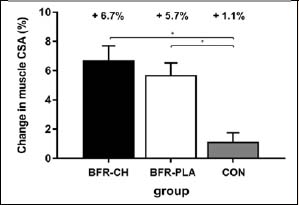
Figure 1.
Percental changes in muscle cross-sectional area at 50% of femur length from pre- to post measurements between the groups (M ± SEM). Differences were analyzed using RMANOVA (* = p < 0.01)
|