 |
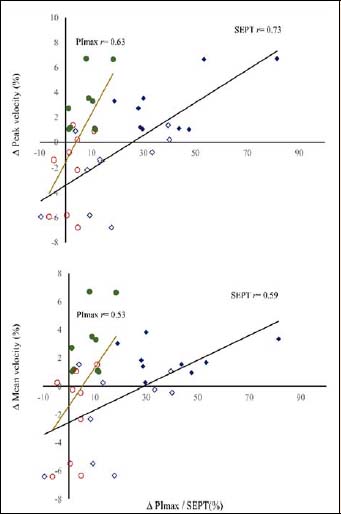
Figure 4.
The percentage change (∆) in (A) peak velocity, and (B) mean velocity between P1-IEP and P2-IEP plotted against the ∆PImax (circle symbols) and ∆SEPT performance (rhombus symbols) between Post-P1 and Pre-P2. â—† and â— are data in RWU trial. â—Š and â—‹ are data in CON trial. Solid lines are the lines of regression.