 |
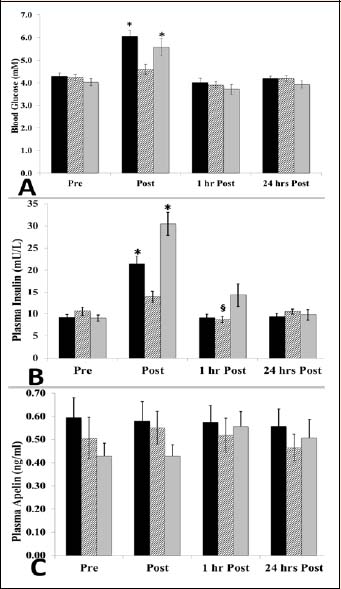
Figure 2.
Blood glucose, plasma insulin and apelin. Values are (mean ± SEM) response to VO2max (black), 70-75% VO2max (striped) and GC (gray) across each of four time points. Blood glucose (A), Insulin (B) and Apelin (C) * Significantly greater than all other time points (p < 0.05). § Significantly lower than pre (p < 0.05).