 |
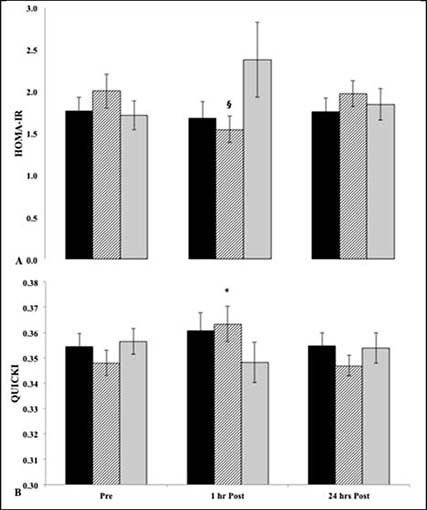
Figure 3.
HOMA-IR and QUICKI indices. Values are (mean ± SEM), response to VO2max (black), 70-75% VO2max (striped) and GC (gray). HOMA-IR (A) and QUICKI (B) indices. Immediate post measures have been omitted, as these do not reflect the resting requirement of indirect insulin sensitivity measures. § Significantly lower than pre (p < 0.05). *Significantly greater than pre (p < 0.05).