 |
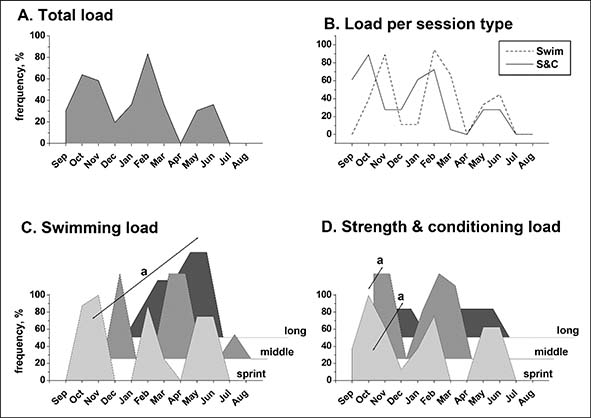
Figure 2.
Distribution of the high intensity training loads throughout a typical training year represented as all sessions combined (A) or per session type (B) for all participants, and for individual distance classifications for Swimming (C) and Strength & conditioning (D) training loads. Correlation analysis for strength of association: a - significantly different annual load distribution (statistically non-significant pattern similarity, p > 0.05).