 |
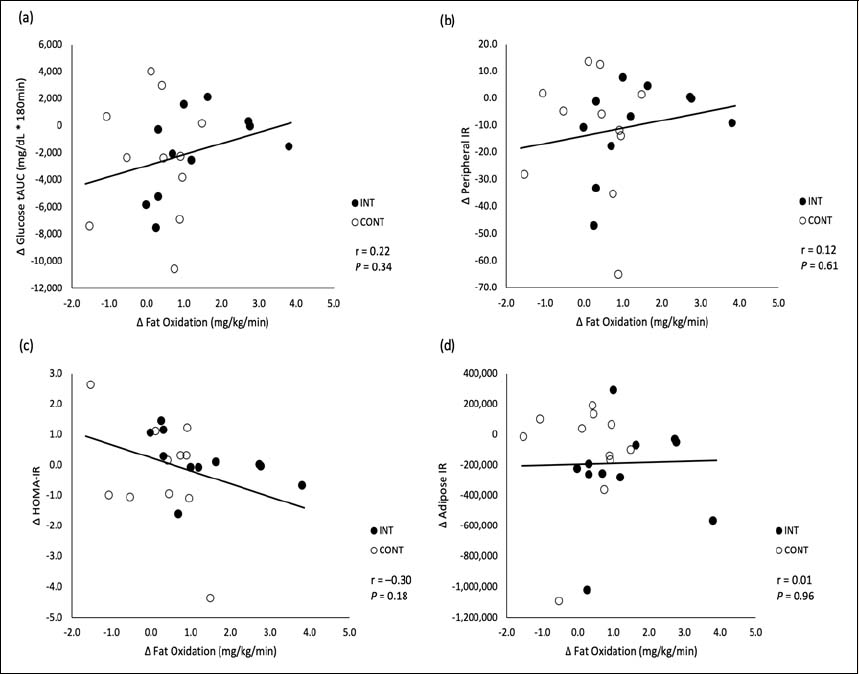
Figure 3.
Correlations between changes in fat oxidation during 70%HRpeak and glucose regulation. Glucose tolerance, 180min OGTT glucose AUC (a); peripheral insulin resistance, 180min OGTT glucose AUC x insulin AUC (b); HOMA-IR (c); adipose IR, 180min OGTT insulin AUC x FFA AUC (d).