 |
Figure 2.
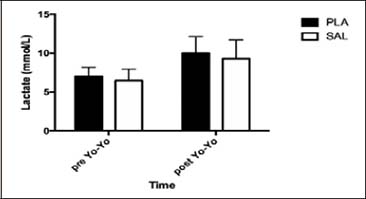
Lactate values collected after sprint pre Yo-Yo IRT and after sprint post Yo-Yo IRT. Data are presented by Mean and SD.
|
|
|
Figure 2.
Lactate values collected after sprint pre Yo-Yo IRT and after sprint post Yo-Yo IRT. Data are presented by Mean and SD.
|