 |
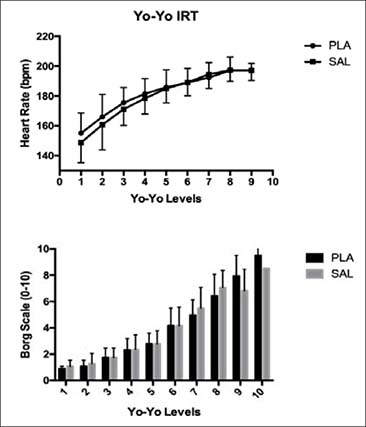
Figure 4.
Heart rate and RPE response at the end of each Yo-Yo IRT level completed by the participants. Data are presented by Mean and SD. Level 10 in heart rate graph is missing because not all participants were able to complete it.
|
|
|
Figure 4.
Heart rate and RPE response at the end of each Yo-Yo IRT level completed by the participants. Data are presented by Mean and SD. Level 10 in heart rate graph is missing because not all participants were able to complete it.
|