 |
Figure 3.
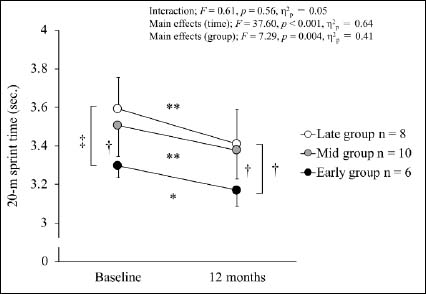
One-year longitudinal changes in the 20-m sprint time. * p < 0.05, ** p < 0.01: vs baseline within a group. † p < 0.05, ‡ p < 0.01: cross-sectional differences among the groups.
|
|
|
Figure 3.
One-year longitudinal changes in the 20-m sprint time. * p < 0.05, ** p < 0.01: vs baseline within a group. † p < 0.05, ‡ p < 0.01: cross-sectional differences among the groups.
|