 |
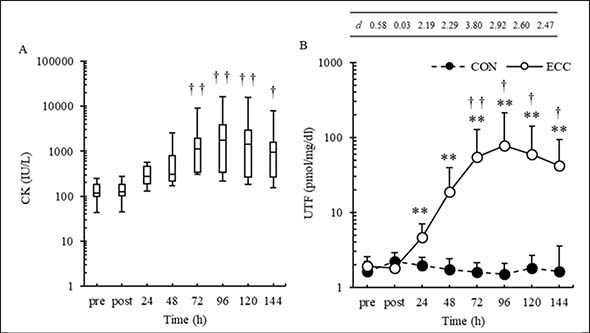
Figure 3.
Change in creatine kinase (CK) in the eccentric condition (A) and change in urinary titin N-terminal fragment (UTF) concentration in the concentric (CON) and eccentric (ECC) conditions (B) before (pre); immediately after (post); and 24, 48, 72, 96, 120, and 144 h after each exercise (mean ± SD). Significant differences were found between post- and pre-exercise values († p < 0.05, † † p < 0.01) and between exercise types (** p < 0.01). Mean ± SE is shown. The table above figure B shows the Cohen’s d (d) at each point over time.