 |
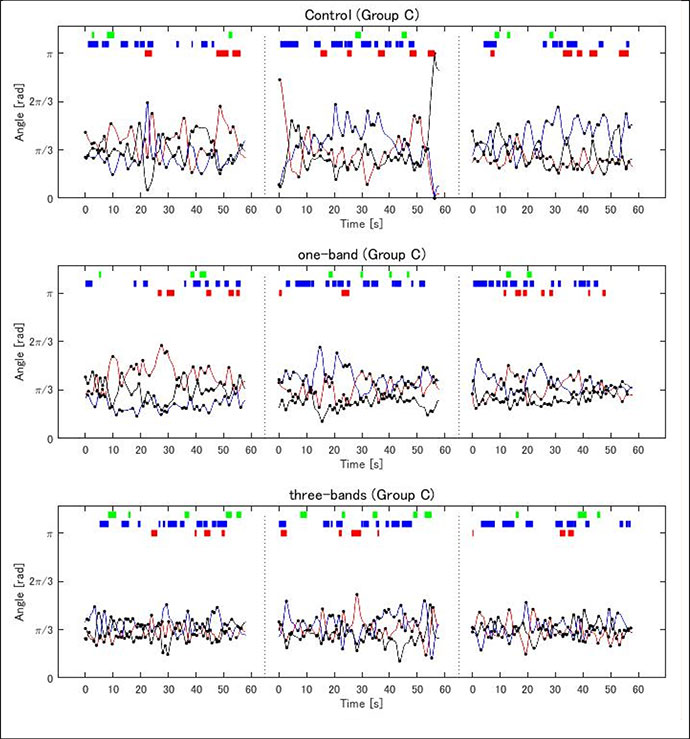
Figure 4.
Example of time series of three trials of inner angles in a triangle formed by a triad. Dot points on each graph indicate the peaks and valleys in the time series. Green, blue, and red labels represent the time duration of synchronized rotation (R) pattern, partial anti-phase (PA) pattern, and partial in-phase (PI) pattern, respectively.