 |
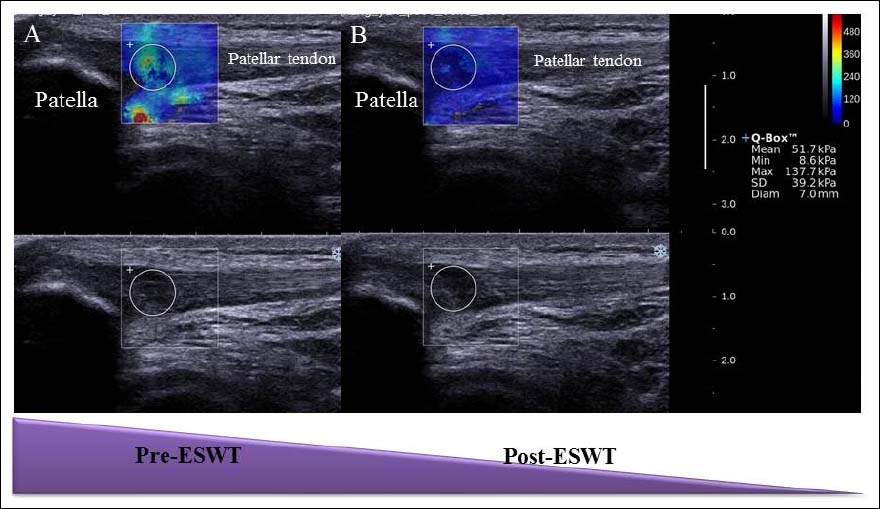
Figure 2.
Images of patellar shear modulus at pre-ESWT and post-ESWT. Upper images show color-coded box presentations of patellar tendon shear modulus superimposed on grey scale sonograms of the patellar tendon. Each circle indicate the region of interest and its corresponding shear modulus is demonstrated under the Q-Box on the right. Bottom images represent grey scale sonograms of patellar tendon on the identical scan planes. ESWT denote Extracorporeal shockwave therapy.