 |
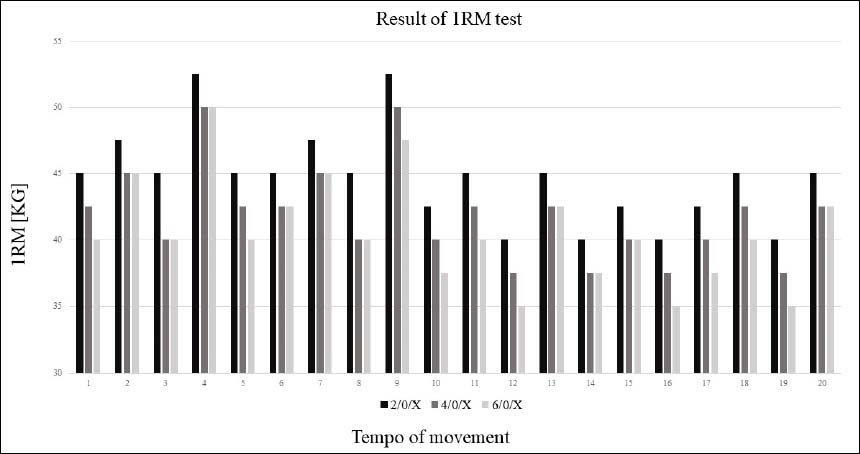
Figure 1.
The individual results of the 1RM test with different movement tempos. Data are presented as result of 1 RM (kg) (as shown on the y-axis). Individual participants, numbered 1-20, are shown on the x-axis.
|
|
|
Figure 1.
The individual results of the 1RM test with different movement tempos. Data are presented as result of 1 RM (kg) (as shown on the y-axis). Individual participants, numbered 1-20, are shown on the x-axis.
|