 |
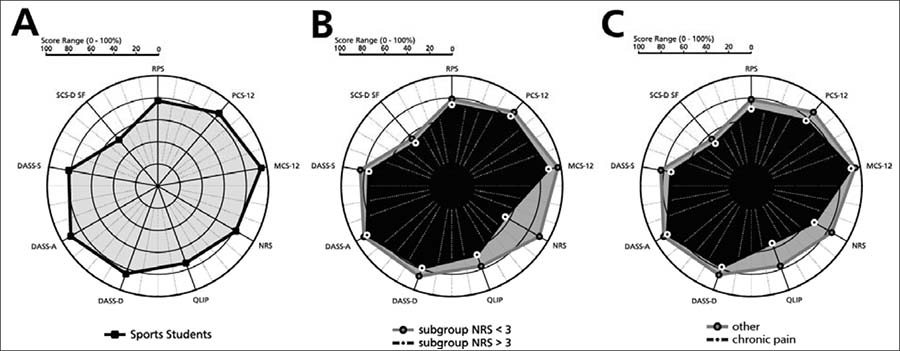
Figure 1.
Polar Chart of Survey Items. Mean (A) and subgroup analysis, i.e. pain intensity (B; < 3 NRS (grey surface), ≥ 3 NRS (black surface)) or occurrence of chronic pain (C; chronic pain (black surface), other (grey surface)) of the survey components. Percentile 100 represents norm and comparative data towards a good constitution in each parameter; all scores have been scaled to 100% with 100% expressing age-controlled expected scores. In detail, scales have been transofrmed as follows (values in parentheses equal to 100%): Regional Pain Scale RPS (0 = no pain); PCS-12 Physical Component Summary of the SF-12 Short Form 12 Health Survey (norm data 56,62 for age 18-24); MCS-12 Mental Component Summary of the SF-12 (norm data 50,03 for age 18-24); NRS Numerical Rating Scale (0 = no pain); QLIP Quality of Live Impairment by Pain (43 = excellent quality of life); SCS-D SF Self-Compassion Scale Short Form (60 = excellent self-compassion); DASS-D/-A/-S Depression, Anxiety and Stress Scales-Depression/-Anxiety/-Stress (0 = little risk for each subscale).