 |
Figure 2.
Forest plot summarizing the effects of traditional plyometrics vs. control on vertical jump height. Data reflects standardized mean differences. CI - confidence intervals.
|
|
|
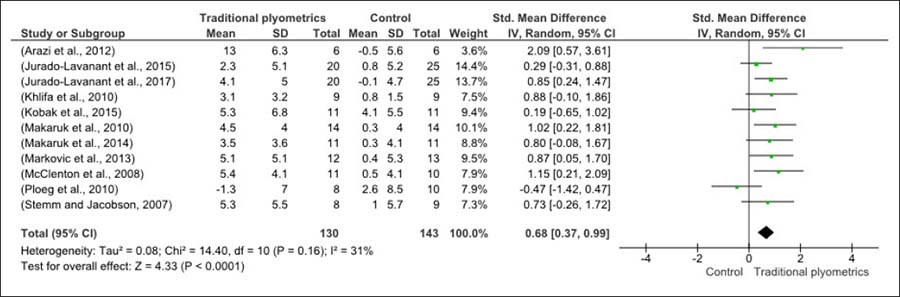
Figure 2.
Forest plot summarizing the effects of traditional plyometrics vs. control on vertical jump height. Data reflects standardized mean differences. CI - confidence intervals.
|