 |
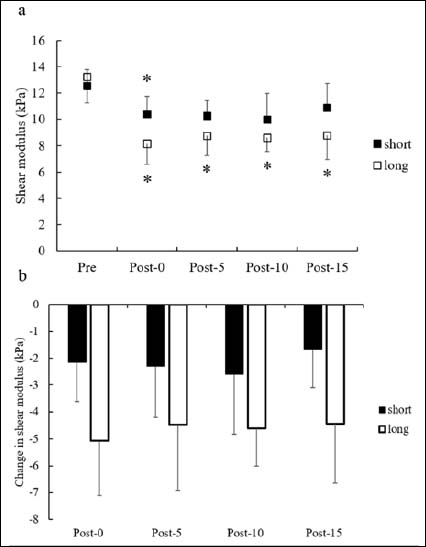
Figure 4.
(a) Shear modulus before (Pre), and immediately- (Post-0), 5 minutes later- (Post-5), 10 minutes later- (Post-10), 15 minutes later- (Post15) after stretching. The filled and empty diamonds represent the mean values of Pre through to Post-15 in the short and long duration groups respectively. The error bar indicates standard deviation. The asterisk means that the shear modulus is significantly lower than that of Pre. (b) Amount of change in shear modulus from Pre. The black and white bar represent the short and long duration groups respectively. The error bar indicates standard deviation. There is significant main effect of group, and the change in shear modulus of the long duration group is significantly larger than that of the short one at all times.