 |
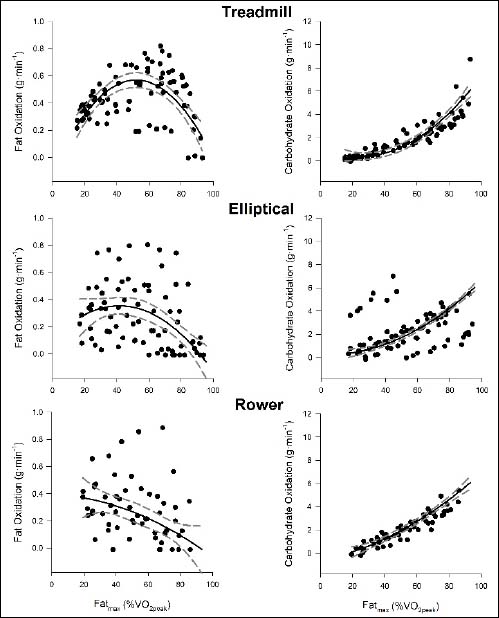
Figure 2.
Scatter plot of fat and CHO oxidation over %V̇O2max during treadmill, elliptical and rowing exercise. Trend line represents the nonlinear 2nd order polynomial regression and dotted lines represents the 95% confidence intervals. Regression values are presented in Table 1.