 |
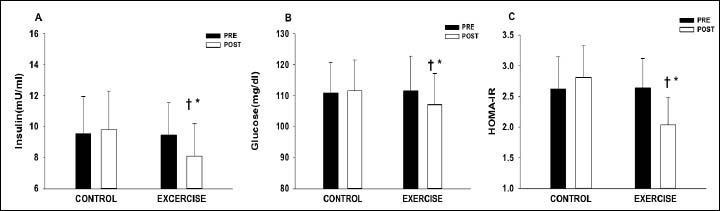
Figure 2.
Changes in glucose, insulin, and HOMA-IR pre and post in control (CON) and exercise (EX) groups. (A) Glucose was significantly decreased in post EX compared to post CON. (B) Insulin was significantly reduced in post EX compared to post CON. (C) HOMA-IR was significantly decreased in post EX compared to post CON. Values are Mean ± SD. * p < 0.05 vs. pre. † p < 0.05 vs. CON.