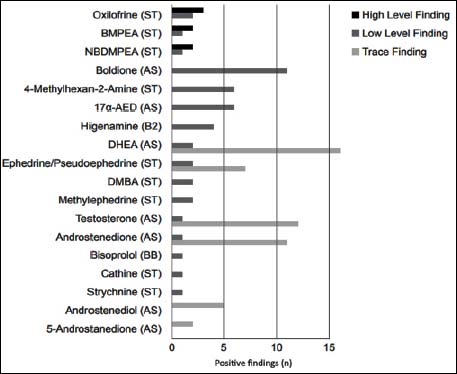
Figure 3.
A vertical bar chart showing the detected doping agents, organized by number of hits.