 |
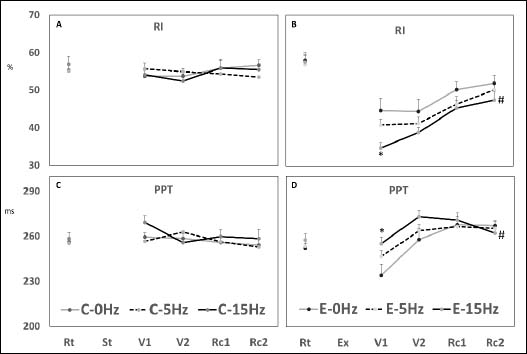
Figure 2.
Waveform analysis of the digital volume pulse at pre- and postexercise (B, D) or static standing (A, C). RI: reflection index. PPT: pulse propagating time. C: control. E: exercise. Rt: seated rest. St: static standing. V1: vibration 0-5 minutes. V2: vibration 6-10 minutes. Rc1: recovery phase 0-5 minutes. Rc2: recovery phase 6-10 minutes. Ex: exercise. #: p-value < 0.05, 15Hz versus 0Hz, repeated measured ANOVA with Tukey post hoc. *: p-value < 0.05, 15Hz versus 0Hz, paired-T test.