 |
Figure 3.
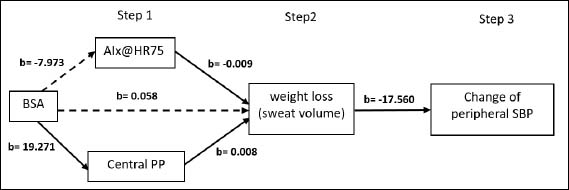
Generalized structural equation modeling (GSEM) in male. The solid line shows that the path was statistically significant (p < 0.05). Changes in peripheral SBP: exercisepost peripheral SBP minus exercisepre peripheral SBP.
|
|
|
Figure 3.
Generalized structural equation modeling (GSEM) in male. The solid line shows that the path was statistically significant (p < 0.05). Changes in peripheral SBP: exercisepost peripheral SBP minus exercisepre peripheral SBP.
|