 |
Figure 4.
Generalized structural equation modeling (GSEM) in total subjects. The solid line shows that the path was statistically significant (p < 0.05). The long-dash line shows that the path had borderline significance (p = 0.056).
|
|
|
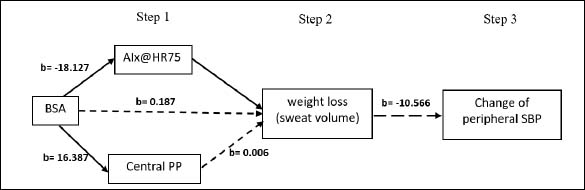
Figure 4.
Generalized structural equation modeling (GSEM) in total subjects. The solid line shows that the path was statistically significant (p < 0.05). The long-dash line shows that the path had borderline significance (p = 0.056).
|