 |
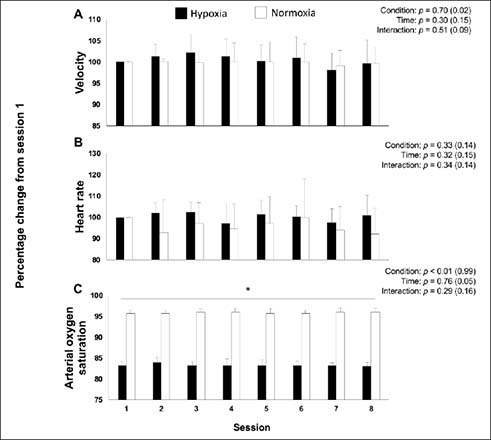
Figure 1.
Changes in velocity (A), heart rate (B) and arterial oxygen saturation (C) during the interval walking workouts. Velocity and heart rate from sessions 2–8 are calculated as change from session 1. All data are presented as mean ± SD. ANOVA main effects of time, condition and interaction are stated along with partial-eta squared into brackets. * denotes a statistically significant difference (p < 0.05) between hypoxia and normoxia.